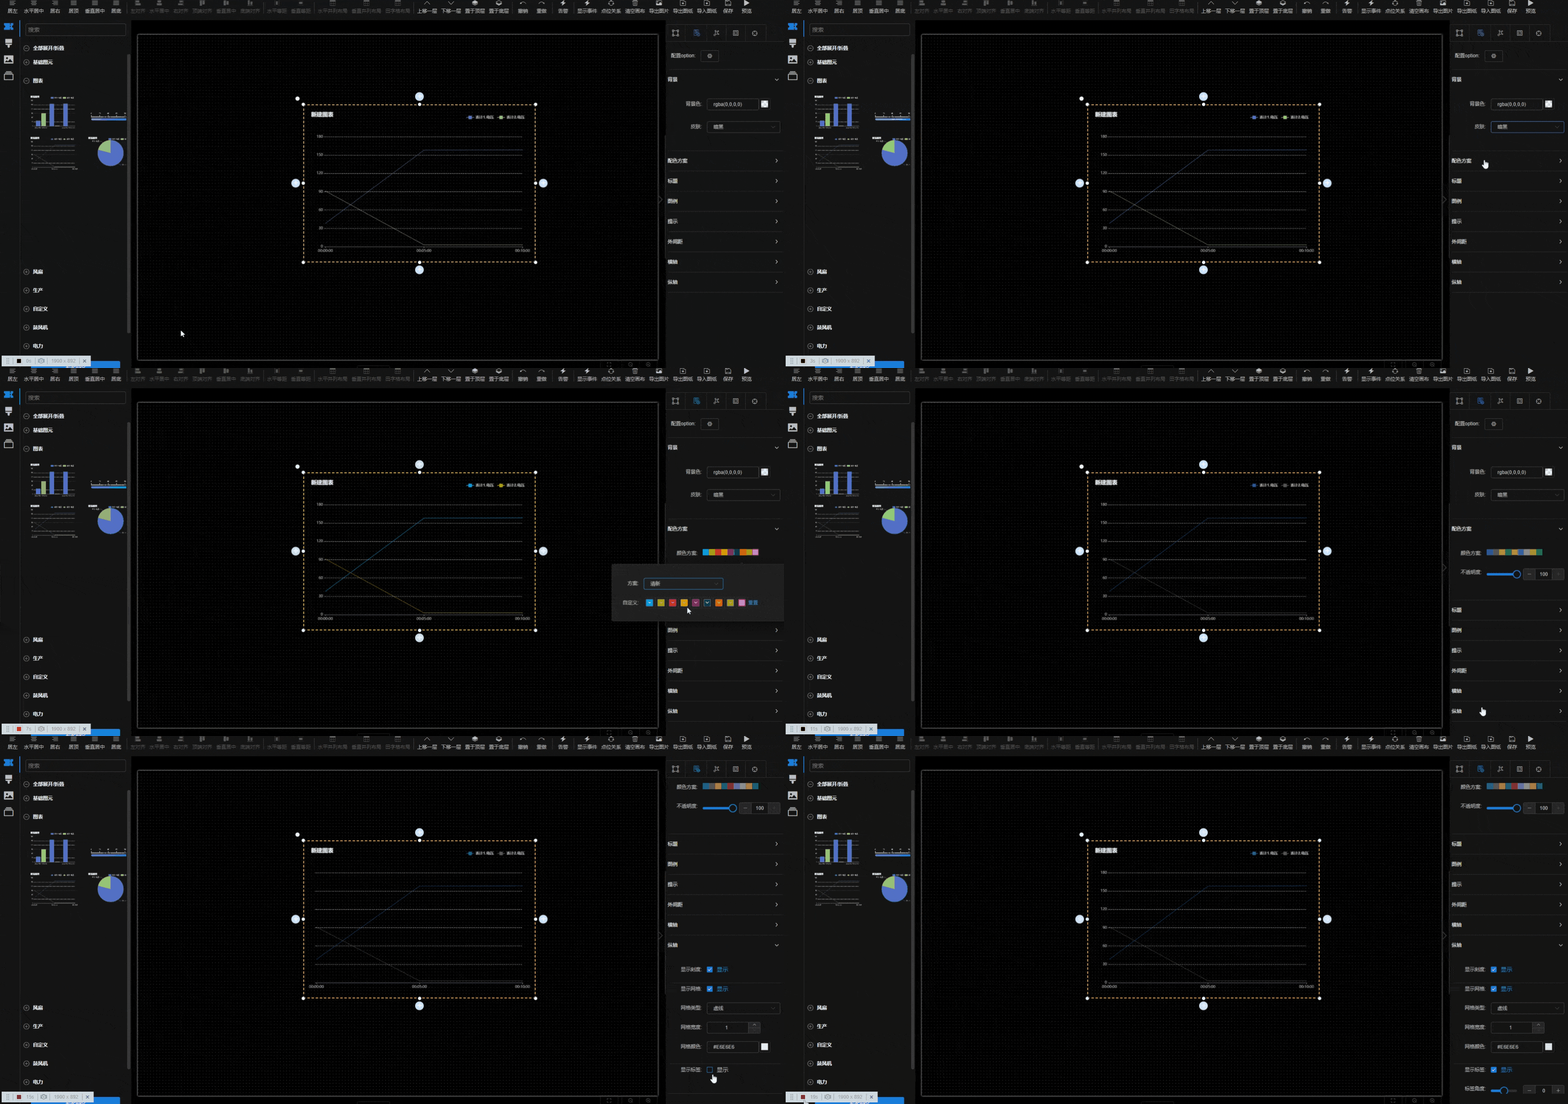
Charts¶ Drag charts onto the canvas, bind data, and choose from 10+ built-in color schemes or custom ones. Configure title, legend, tooltip, margins, and axis settings online. Line Chart